Irregular Rhythms

  1. Sinus Arrhythmia

  2. Wandering Pacemaker

  3. Atrial Fibrillation

Early or Late Beats

Premature atrial contraction (PAC):

The atria fires an early impulse which causes the heart to beat earlier causing irregularity in the heart rhythm.

Premature ventricular contraction (PVC):

The ventricles fire an early impulse which causes the heart to beat earlier causing irregularity in the heart rhythm.

Fast Rhythms

Fast rhythms occur when rapid pacing of the heart is coming from an abnormal location (ectopic focus).

Three types of fast rhythms: The keys are the rate and the P waves.

  1. Paroxysmal Tachycardia – heart rates of 100 -250 beats/min
  2. Flutter – heart rates of 250 – 350 beats/min
  3. Fibrillation  – heart rates of 350 – 450 beats/min

1. Paroxysmal Tachycardias

  • Paroxysmal – sudden, tachycardia – heart rate.
  • Sudden, rapid rhythms can originate in: atria, AV node (junction), ventricles.

Supraventricular Tachycardia

    • Abnormal heart rhythm, from abnormal (ectopic) site.
    • Impulse stimulating the heart is NOT generated by the sinus node!
    • Impulse comes from tissue involving the AV node.
    • Impulses are generated at a fast, rapid pulse around 280 beats per minute.

A. Paroxysmal Atrial Tachycardia

    • Paroxysmal atrial tachycardia is the sudden, rapid firing of an ectopic focus (abnormal location) in the atria
    • Characteristics:
      • P waves are present
      • Rate is 100 -250 beats/min

B. Paroxysmal Junctional Tachycardia (“accelerated junctional rhythm”)

    • Paroxysmal junctional tachycardia is the sudden, rapid firing of an ectopic focus in the AV node
    • Characteristics:
      • No P waves 
      • Rate is between 100 – 250 beats/min.

Both PAT and PJT originate above ventricles and could be called “Supraventricular Tachycardia” 

C. Paroxysmal Ventricular Tachycardia (“ventricular tachycardia”)

2. Flutter

  • Rate is 250 – 350 beats/min.

A.  Atrial Flutter

    • Occurs when a single ectopic focus in atria fires rapidly
    • Characteristics
      • IdenticalP waves with “saw-tooth” appearance in lead II
      • Origin: Atria

File:Aflutt small.svg

B.  Ventricular Flutter

    • Occurs when an ectopic focus in ventricles begins to fire rapidly
    • Degenerates, most frequently into ventricular fibrillation.
    • Emergency – needs immediate treatment.
    • Causes: acute myocardial infarction, drugs (digoxin, quinidine, tricyclic antidepressants) 
    • Characteristics
      • Heart rate of 180 – 250 beats/min.
      • No P waves 
      • QRS complex is wide.

3. Fibrillation

    • Rate is greater than 350 beats/min.
    • Fibrillation may be atrial (P waves) or ventricular (QRS complex). 
    • Occurs when multiple ectopic foci are firing almost continuously. 

Atrial Fibrillation

    • Occurs when the ectopic foci are are located in the atria – abnormal electrical signals begin in atria (top chambers) of heart, causing heart beat to be too fast, too slow, or rhythm to be irregular.
    • Atrial Fibrillation increases risk of: blood clots, stroke, heart failure.
    • Age increases the likelihood one has it 
    • Characteristics
      • Irregular baseline
      • No visible P waves. 
      • Irregular QRS complexes

Ventricular Fibrillation

    • Complete distortion and irregularity of the QRS complexes
    • Occurs when multiple foci are firing in ventricle – chaotic depolarization of random ventricular cells
    • Ventricular tachycardia will lead to ventricular fibrillation if not treated immediately.  Most common fatal dysrthmyia 
    • As tissue dies, the voltage increases
    • Symptoms
      • Chest pain, Dizziness, nausea, rapid heartbeat, shortness of breath
    • Due to serious hemodynamic consequences which are inducing: loss of pump function of the heart, collapse of cardiac output of blood pressure.
    • Conditions that can lead to VF include:
      • Electrocution accidents or injury to the heart
      • Heart attack
      • Heart disease present at birth (congenital) 
      • Heart surgery
      • Heart muscle disease
      • Narrowed coronary arteries
      • Sudden cardiac death
      • Most people with VF have no history of heart disease
    • Treatment
      • Medical Emergency – Immediate treatment
      • 911 – do CPR by starting chest compressions until 911 arrives
      • Quick electric shock w/ external defibrillator which restores the heartbeat to normal rhythm 
    • Characteristics
      • No pulse


Similar:

Irregular Rhythms 

Early (Premature) and Late (Excape) Beats

Heart Blocks

Myocardial Ischemia


Myocardial Infaction


Main cause: occlusion of a coronary artery, stops blood flow to a portion of the muscle


“Three eyes” in the development of an acute myocardial infarction:
  1. Ischemia
  2. Injury
  3. Infarction – nearly all occur in the left ventricle

Ischaemia 

“Reduced blood flow” – occurs when blood flow to a muscle is insufficient to meet the oxygen requirements of that muscle. When this muscle is the heart, it is termed myocardial ischaemia.

Myocardial ischaemia generally occurs as a result of narrowed coronary arteries. If blood flow is soon increased, or oxygen requirements are lowered, ischaemia will resolve without permanent muscle damage.

Characteristics:

  • Diagnosed when inverted T waves appear on the ECG
  • Depressed ST segment in one of more leads of the ECG.
  • In some cases no effect is visible at all.

myocardial infarction (or heart attack) occurs if an adequate blood flow is not restored and the heart muscle dies. Initially symptoms similar to an ischaemic attack will occur as the muscle cells operate anaerobically, however, the pain is sudden and not stress related.

Myocardial Ischaemia
Conduction: Myocardial Ischaemia

In the following example, the ST segment (shaded) is depressed below the isoelectric PR segment (arrowed).

Electrocardiogram: ST Segment Depression

Myocardial Infarctions

4 walls of the left ventricle where infractions occur

  1. Lateral – aVL, II (left coronary artery)
  2. Inferior – II, III, aVF (right coronary artery)
  3. Anterior  – V1, v2, V3, V4 (left coronary artery)
  4. Posterior – V1 (right coronary artery) 

Lateral infarctions

  • Show S-T elevation and/or Q waves in leads along side of heart (+ electrode on left arm)
  • Left coronary artery
  • Lateral leads: aV,  Lead I
    • V5, V6

Inferior infarctions

  • Show elevated S-T segments &/or Q waves in leads below heart (+ electrode is on left leg)
  • Inferior leads: II, III, aVF
  • Common area for infarctions to occur 
  • Right coronary artery

Anterior Infarctions

  • Show elevated S-T segments (&/or Q waves) in the leads on the front side of heart (+ electrode is directly over heart)
  • Left coronary artery
  • Anterior leads: V1, V2, V3, V4
Posterior Infarctions
  • Show a large R wave w/ a depressed S-T segment will show infarct to be on backside of heart
  • Show reverse of anterior infarction in lead V1
  • Not as common as other 3
Source: http://www.cardionetics.com/cardiology/myocardial-ischaemia.php

Ventricular Hypertrophy

Ventricular Hypertrophy is diagnosed by R wave changes in Lead V1 and V5.

Left ventricular hypertrophy

  • Results from an increase in left ventricular workload (during hypertension or aortic valve stenosis) 

Characteristics:

  • R wave in V5 will be increased
  • S wave in V1 will be increased.

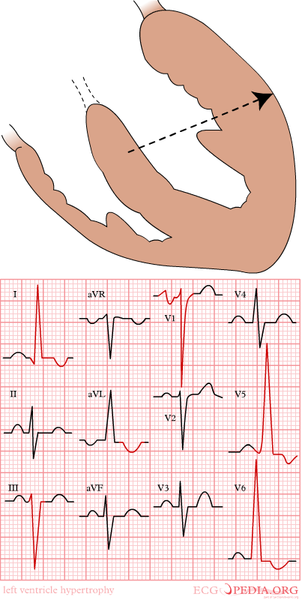
As the left ventricular wall becomes thicker, the QRS complexes become larger.

  • QRS complexes larger in V1 -V6
  • This is especially true for leads V1-V6.
  • S wave in V1 is deep
  • R wave in V4 is high.
  • Some ST depression can be seen in leads V5-V6
  • LVH. R in V5 is 26mm, S in V1 in 15mm. The sum is 41 mm which is more than 35 mm and therefore LVH is present according to

Right Ventricular Hypertrophy

  • Results from an increase in right ventricular workload, e.g., emphysema or pulmonary embolization.
  • Occurs in lung disease or in congenital heart disease.
Characteristics

  • Negative QRS complex in Lead I (right heart axis)
  • R wave in V1 will be large. 

Right ventricular hypertrophy, the R wave is greater than the S wave in V1

Atrial Hypertrophy

General Characteristics of Hypertrophy

In hypertrophy the heart muscle becomes thicker. Hypertrophy refers to an increase in the size or mass of the heart muscle.

  • Increase amplitude of waves
  • Axis shift towards greater amount of muscle mass
  • Increased duration of waves

Atrial Enlargement or Hypertrophy

  • Atrial hypertrophy is best seen in Lead V1 (which is directly over atria)
  • P wave in lead V1 will appear diphastic (both positive and negative)

Right Atrial Enlargement (RAE) – Right Atrial Hypertrophy

Right atrial enlargement can result from increased pressure in the pulmonary artery, e.g. after pulmonary embolization

Causes:

  • Often a result of severe lung disease

Characteristics

  • Right atrial hypertrophy is diagnosed when first part of diphasic P wave is biggest.
  • Peaked P waves (P wave height greater than or equal to 2.5 mm) in leads II, III, and aVF
  • No change in P wave duration – Width of p wave does not change.

Left Atrial Enlargement (LAE)

AKA: Left atrial hypertrophy, left atrial abnormality.

Leads to delayed activation of left atrium and thus prolonged depolarization and a prolonged P wave.

Background

  • Left atrial enlargement (LAE) is due to pressure or volume overload of the left atrium.
  • It is often a precursor to atrial fibrillation.

Electrocardiographic Criteria

LAE produces a broad, bifid P wave in lead II (P mitrale) and enlarges the terminal negative portion of the P wave in V1.

Diagnostic criteria are as follows:

In lead II

  • Bifid P wave with > 40 ms between the two peaks
  • Total P wave duration > 110 ms

In V1

  • Biphasic P wave with terminal negative portion > 40 ms duration
  • Biphasic P wave with terminal negative portion > 1mm deep

Characteristics

  • A notched P wave in Lead II
  • Diagnosed when the second part of the diphasic P wave is biggest.
  • Increased duration of the P wave; terminal portion of P wave must span atleast one small box (40 msec)
  • P wave with a broad (0.04 sec or 1 small square) and deeply negative (>1 mm) terminal part in V1
  • P wave duration longer than 0.12 sec in leads I and / or II (Usually lead II)

Causes

In isolation:

  • Classically seen with mitral stenosis
  • Left atrial enlargement is also known as “P mitrale” because it is associated with mitral valve insufficiency, resulting in back flow of blood from the left ventricle to the left atrium and subsequent increased local pressure.

In association with left ventricular hypertrophy:

  • Systemic hypertension
  • Aortic stenosis
  • Mitral incompetence
  • Hypertrophic cardiomyopathy

Broad (>110ms), bifid P wave in lead II (P mitrale) with > 40ms between the peaks

P wave terminal portion > 40 ms duration in V1

Bi-Atrial Enlargement (BAE)

  • Diagnosed when RAE and LAE are present
  • P wave in lead II > 2.5 mm tall and ≥ 0.12s in duration
  • Initial positive component of P wave in V1 > 1.5 mm tall and prominent P-terminal force

Example 1

Biatrial enlargement due to idiopathic cardiomyopathy:

  • Biphasic P waves in V1 with a very tall positive deflection (almost 3 mm in height!) and a negative deflection that is both deep (> 1 mm) and wide (> 40 ms).

Example 2

Biatrial enlargement:

  • P waves in lead II are tall (> 2.5mm) and wide (> 120 ms).
  • P waves in V2 are tall (> 1.5 mm), while the terminal negative portion of V1 is deep (> 1mm) and wide (> 40 ms).

ECG challenge

Two patients provide an opportunity to apply these principles:

A 75-year-old man with pulmonary hypertension has an ECG as part of his yearly examination (Figure 2; click image to enlarge).

Based on the stepwise approach to evaluating an ECG, consider the following:

(1)  Does the ECG indicate a regular heartbeat? Yes, the QRS complexes march out.

(2)  Determine the patient’s heart rate by finding a QRS complex on or near a dark line.

Method A: The number of large boxes between Rs is close to four. Four boxes puts the rate at 75 beats per minute.

Method B: Approximately seven QRS complexes occur in 6 seconds (30 large boxes), which estimates the heart rate at 70 beats per minute (7 × 10 = 70). 

Method C: Dividing 300 by the number of large boxes between QRS complexes (4) yields an estimate of 75 beats per minute.

(3)  A P wave appears before each QRS complex. Is the contour of the P wave the same in all leads? In lead II, the P wave is peaked and has a normal duration. The P wave in V1 is biphasic, with no increase in the upslope of the first deflection.

(4)  The PR interval spans approximately three small boxes (0.12 seconds), indicating a sinus rhythm. 

(5)  The QRS complex spans fewer than three small boxes, which is normal.

(6)  The ST segments are neutral, so there is no ischemia.

(7)  The T wave is positively deflected in all leads except the aVR. 

(8)  There are no U waves

This ECG indicates that the patient is in sinus rhythm and has RAE.

The second patient is a 53-year-old woman who complains of fatigue, dyspnea, and mild chest discomfort. On auscultation, you hear a mid-diastolic low-pitched murmur. The ECG is shown in Figure 3 (click image to enlarge).


(1)  Is this ECG regular? Yes, the QRS complexes march out.

(2)  Heart rate:

Method A: The number of large boxes between Rs is close to three. Three boxes would put the rate at 100 beats per minute.

Method B: Approximately 10 QRS complexes occur in 6 seconds (30 large boxes), resulting in an estimated rate of 100 beats per minute (10 × 10 = 100).

Method C: Dividing 300 by the number of large boxes between QRS complexes (3) yields a heart rate of 100 beats per minute.

(3)  There is a P wave for every QRS complex. Is the contour the same? A notched P wave in lead II has a prolonged duration. The P wave in V1 is biphasic, has an increased down slope in the terminal portion, and spans more than one small box (ie, more than 40 milliseconds in duration).

(4)  The PR interval is approximately three small boxes, which is 0.12 seconds, indicating a sinus rhythm.

(5)  The QRS complex spans fewer than three small boxes, which is normal.

(6)  The ST segments are neutral; there is no ischemia.

(7)  The T wave is positively deflected in all leads except the aVR. 

(8)  There are no U waves

This ECG indicates that the patient is in sinus rhythm and has LAE.

Sources: JAAPA